All Features

Dashboards

Centralized data visualization. Get a comprehensive overview of critical metrics. Customizable, intuitive dashboards for informed insights and proactive management.

feature-banner-dashboards

PiERP’s Dashboards- Your Digital Advantage

PiERP’s dashboards are a real asset for every enterprise looking to transform its digital ecosystem in an unprecedented manner.

feature-dashboards-keybenefits-1

Key Benefits

  • Easy-to-configure visuals: Easily bring together all your data in one place using PiERP’s user-friendly visuals. No more searching for information – everything you need is right there, displayed exactly as you prefer. In other words, work smarter-work faster.
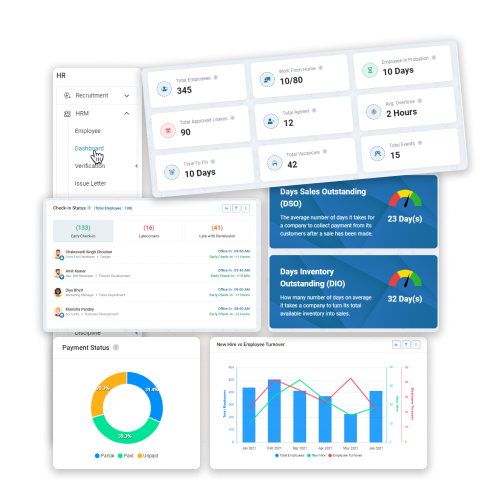
  • Dashboards for every team: Creating dashboards your way is possible with PiERP. From individuals to teams and departments, everyone can customize the dashboards their way so that you can visualize valuable information at every level of the organization.
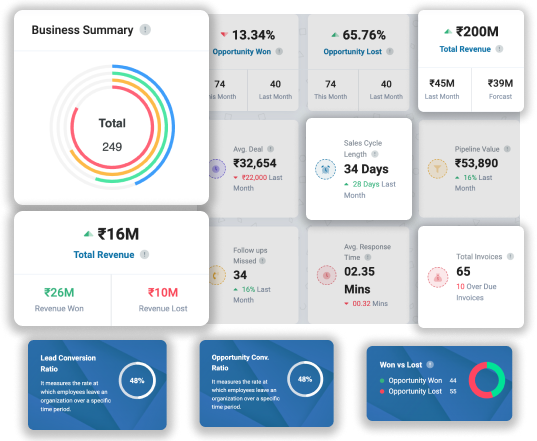
  • Embed charts & track metrics: Leverage the power of dynamic widgets your way! Whether it is using these widgets to embed charts or tracking key metrics, you can do it all with PiERP’s dashboards. What’s more? Summarize every detail in tables.
  • Vast widget library: Owing to an enormous widget library at your disposal, you can customize dashboards according to the needs of a particular project. From adding text to links, charts, metrics, and announcements; you can do plenty with this widget library.
feature-dashboards-keybenefits-2

Key Benefits

  • Sync your tools: Sky is the limit with PiERP’s dashboards as you can go beyond the confines of PiERP’s items when it comes to synchronization. From embedding docs to Jira, custom HTML, MS Office, and much more PiERP demonstrates exceptional flexibility.
  • Social media integration: From Facebook pages, feeds, and profiles to Linked in & Twitter posts, social media integration with PiERP dashboards is a breeze. Embedding social media posts and displaying them your way couldn’t get easier and better than this.
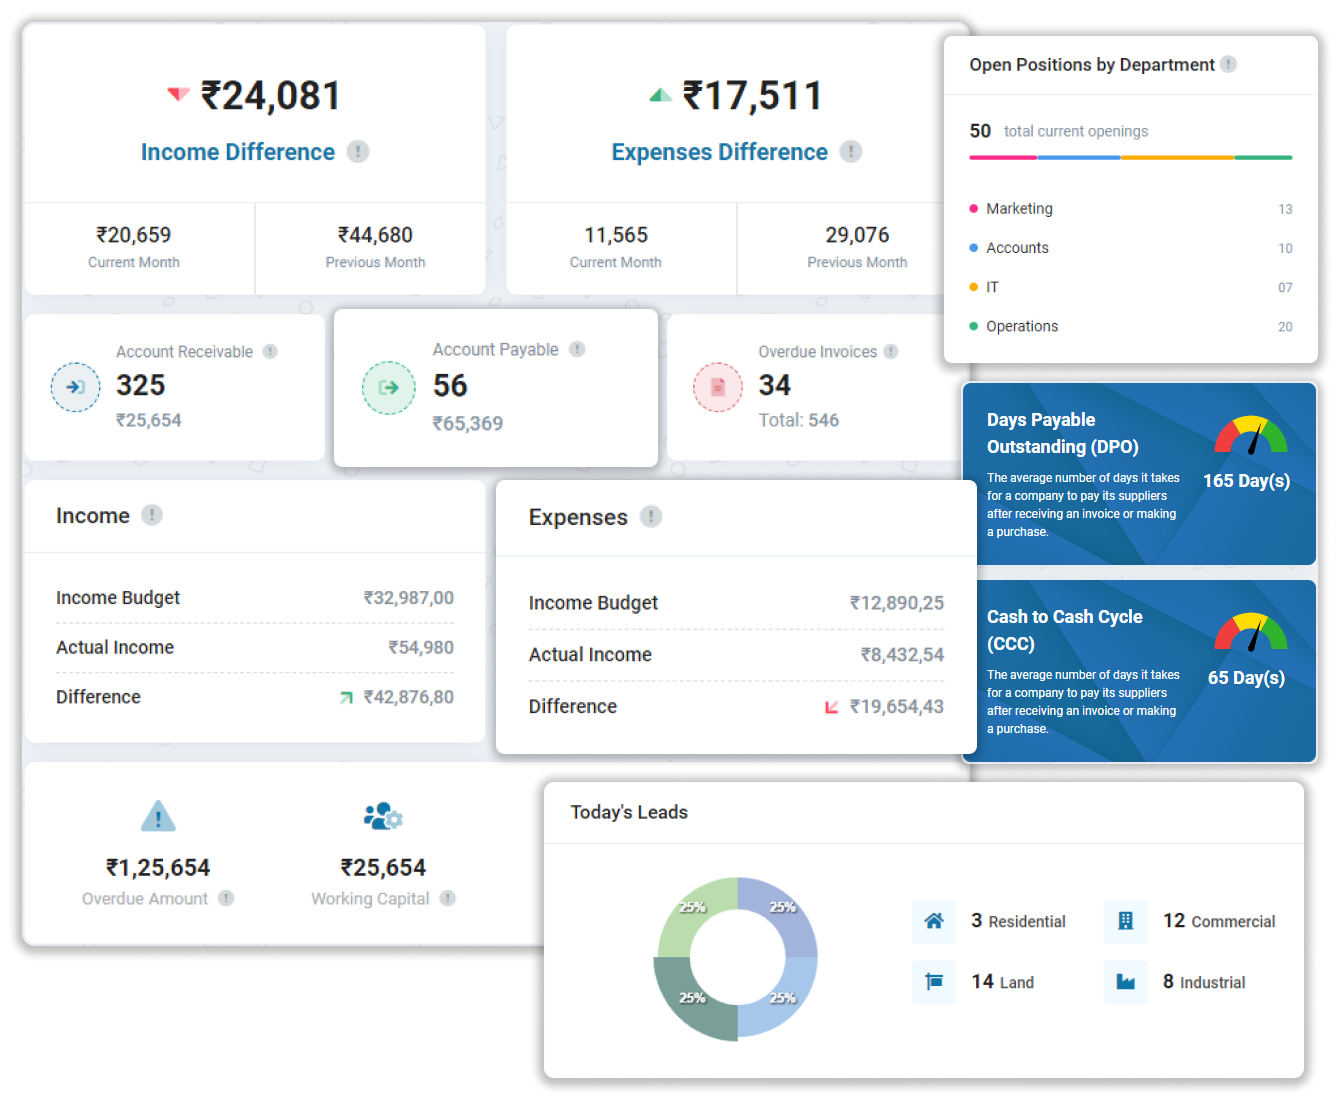
  • Decision support: Dashboards help users make decisions by showing important data visually. They provide insights and suggestions based on the information, helping users prioritize tasks and manage resources better to fetch desired results.
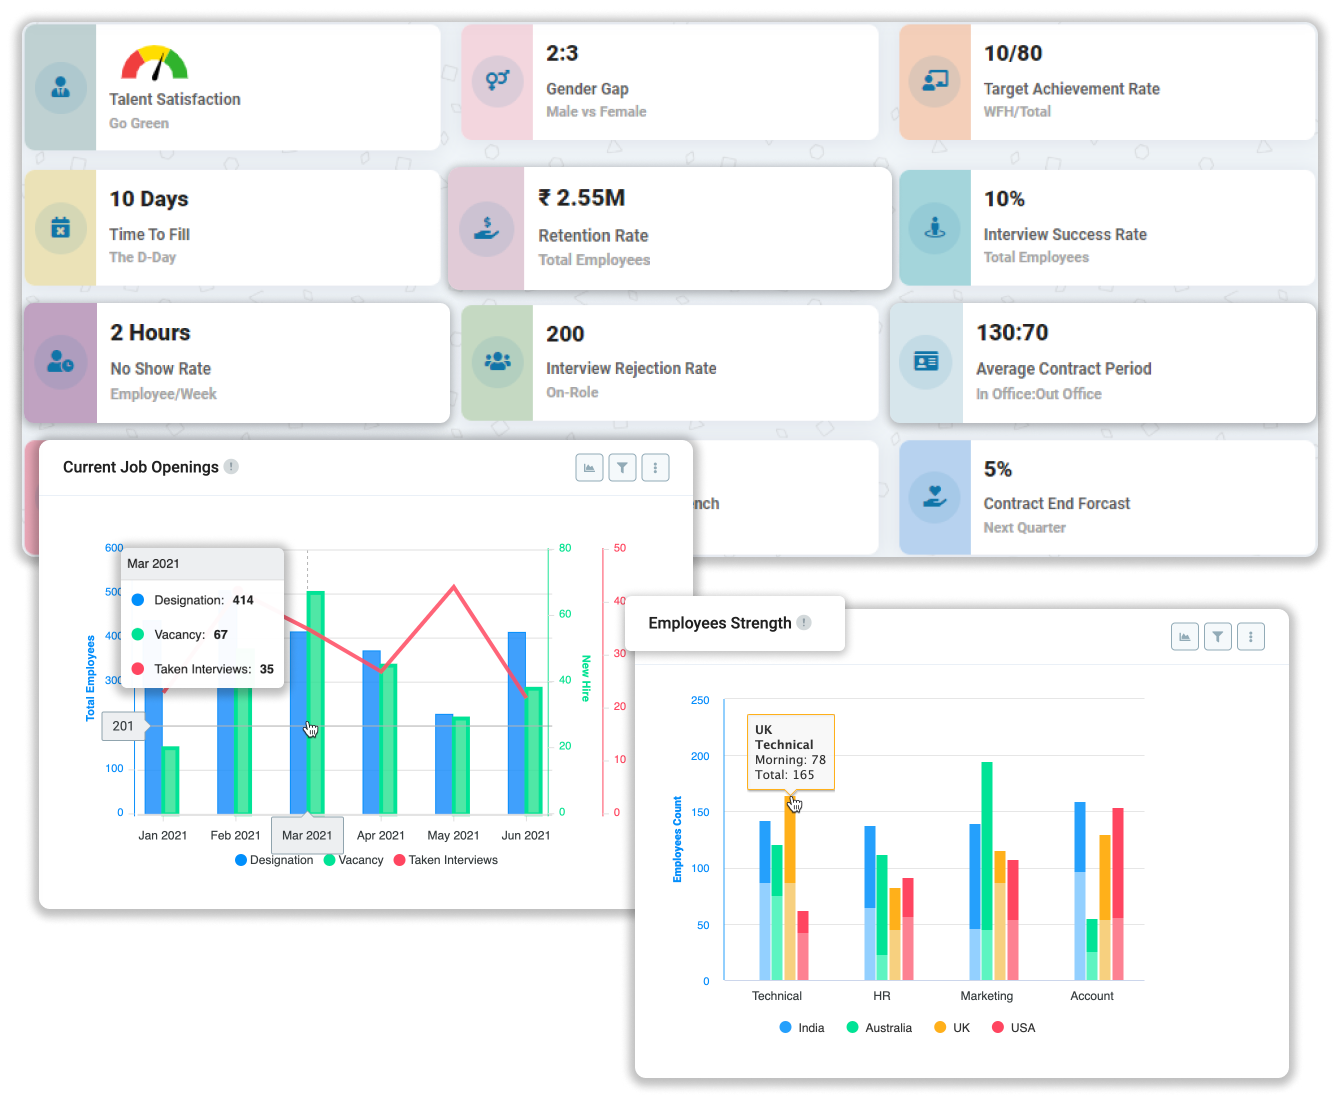
  • A wide array of charts: Be spoilt for choices as PiERP brings at your disposal a multitude of chart options, including donut, column, line, and pie charts, alongside versatile views like chart, grid, and data schema. PiERP dashboards offer diverse visualization capabilities.

How it makes a difference?

It is time to empower your team with simplified monitoring and tracking capabilities, streamlining operations and optimizing decision-making processes for 360-degree efficiency.

Customization

With customizable dashboards, you can customize views as per your preferences, priorities, and workflow needs. Adjust layouts, select KPIs, & customize widgets.

Real-time data updates

Dashboards offer real-time updates on crucial metrics, allowing users to monitor operations and track progress instantly. With current information accessible, users can make timely decisions.

Cross-functional insights

Foster cross-departmental collaboration through a comprehensive view of operations. Users from different roles can access shared dashboards, gaining insights into common goals and performance metrics.

Operational Mechanism

How it works?

Tailored for all sectors, PiERP simplifies collaboration with embedded meeting tools and seamless integration of indispensable apps.

thumb
  • Caters to every industry

    PiERP caters to the unique needs of every department and industry spanning sales, accounts, non-profit organizations, and engineering. With its versatile functionality & customizable features, PiERP ensures seamless integration and optimization across diverse sectors and organizational structures.

  • Collaboration Tools

    Dashboards also have collaboration tools like comments, annotations, and sharing functions. This enables users to collaborate, communicate, & share insights. This encourages teamwork, knowledge exchange, and data-driven decision-making across the organization.

  • Security & Permissions

    Dashboards integrate security measures and permission settings to limit user access to relevant data. This includes role-based controls, encryption, and audit trails. It easily safeguards sensitive information and maintains data integrity with sheer ease so that you can remain compliant.

Boost productivity and drive growth with PiERP
Streamline your business operations with our powerful suite of solutions.